
Reading California's Upland Harvest: A County Map of Where the Birds Were Taken in 2023–24
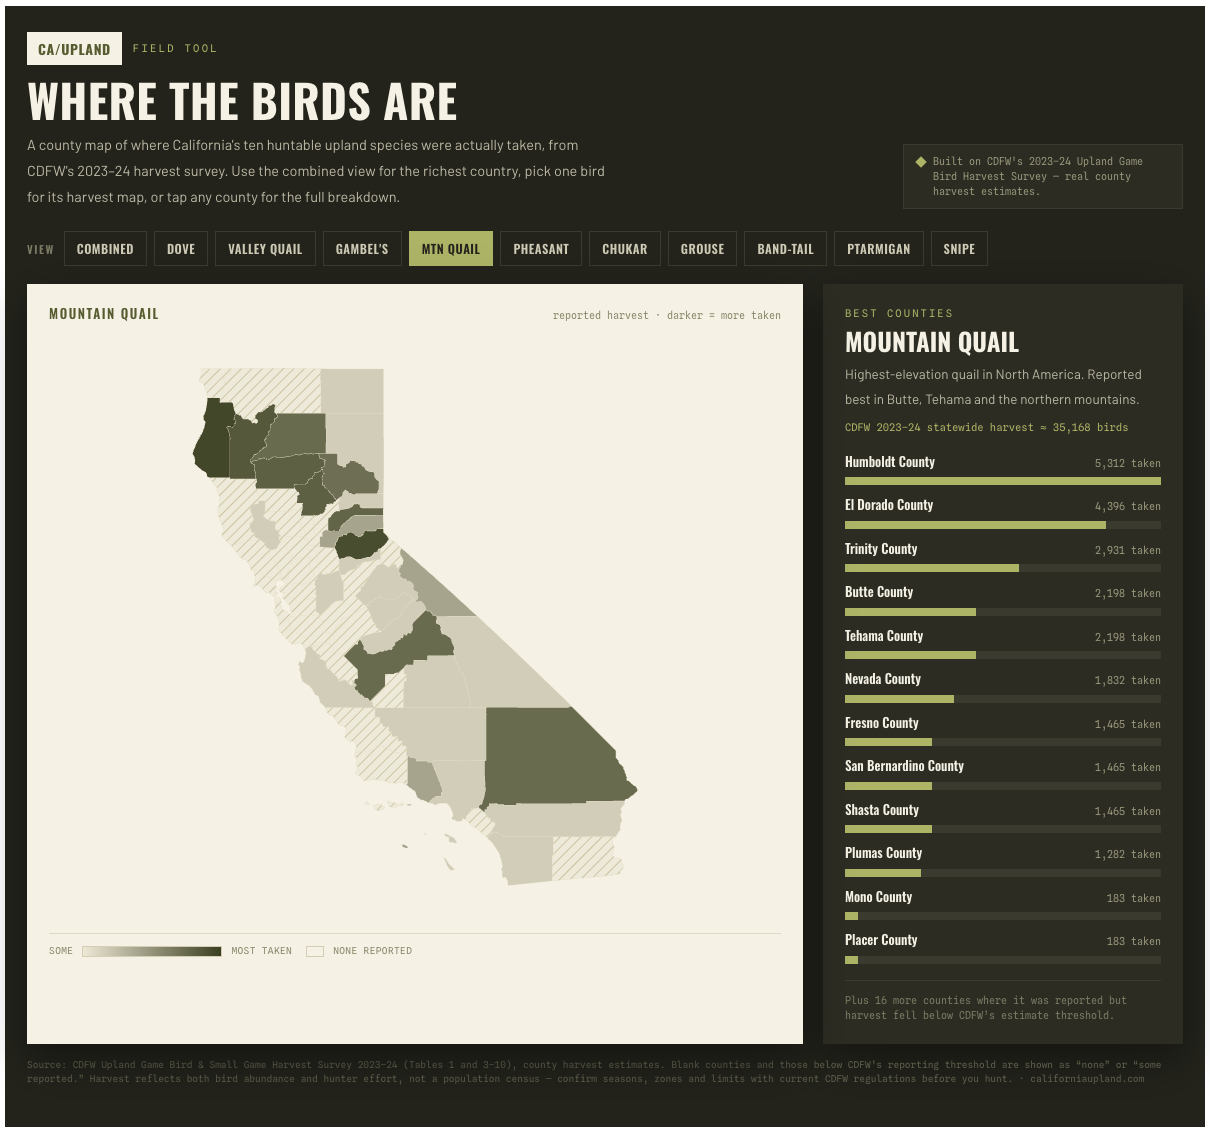
Every California upland hunter carries a rough map in their head. Doves over the Imperial and San Joaquin ag ground. Valley quail in the foothill oak-and-chaparral. Chukar in the broken country of the northeast and the eastern deserts. Pheasant on the Sacramento Valley floor. That mental map is mostly right — and now, for the first time on this site, you can check it against the actual numbers, county by county.
We pulled every county harvest table out of CDFW's Upland and Small Game Hunter Harvest Survey Report 2023–2024 and built them into an interactive map: Where the Birds Are. Ten huntable species, all fifty-eight counties, one screen. Pick a bird to see where it was taken, or tap a county for the full breakdown of everything hunters reported there. This piece is the companion to that tool — what it's built on, what the numbers honestly mean, and how to read them for your own planning.
A word on what this is and isn't, in the same spirit we bring to every research-based piece here. This is not a field report. It is a data-and-tool piece: it presents CDFW's published estimates and explains how to use them. When we say a county "led the harvest," we mean the survey says so — not that we were standing in it. Read this as the map's owner's manual, not as a scouting confession.
What the map shows
The map has two ways in. The combined view shades each county by how many of the ten species hunters reported taking there — the quick read on which counties are the richest all-around upland country. Switch to any single bird and the map becomes that species' harvest map: darker counties, more birds taken. Tap a county in either view and the panel lists every species reported there, ranked, with the actual number of birds harvested.
Those numbers come straight from the survey. California quail, statewide, was an estimated 221,633 birds harvested in 2023–24; the leaders were Tehama at 29,673, Kern at 22,896, and Monterey at 20,148. Dove — mourning and white-winged together — dwarfs everything else at 826,269 birds, heaviest over Imperial (128,584) and the southern San Joaquin. Chukar, a hair under 31,000 statewide, concentrates hard in the northeast, with Lassen alone reporting 13,738. Ring-necked pheasant, at 28,757, is a Sacramento Valley story, with Colusa on top at 8,426. None of that will surprise a hunter who's been paying attention. Seeing it laid out on the county map is a different thing than knowing it in the abstract.
What the numbers actually measure — and what they don't
Here is the part worth slowing down on, because it's the difference between using this map well and misreading it.
Harvest is not a bird census. The survey measures what hunters reported taking, which is a product of two things at once: how many birds are there, and how many hunters went after them. A county with tremendous quail habitat and almost no hunters will show a low number. A county with modest bird numbers but easy access and heavy pressure can show a high one. Harvest is a real signal — it's the best statewide, county-level data California publishes on these species — but it's a signal about hunting, not just about birds.
Sparse data is its own kind of honest. For the big-harvest species — dove, valley quail, mountain quail, pheasant, chukar — enough hunters report that CDFW can put a real county estimate on the board, and the map shades those counties on a true gradient. For the thin-harvest species — Gambel's quail, the two grouse, band-tailed pigeon, Wilson's snipe — so few hunters report that almost no county clears CDFW's estimate threshold. Rather than invent a number, the map shows those counties as "some reported" where hunters registered the bird at all, and "none reported"everywhere else. That's not the map failing; that's the map telling the truth about a bird few people pursue. Band-tailed pigeon, for instance, shows up thinly from Humboldt to San Diego and clears an estimate nowhere — exactly what you'd expect for a bird almost nobody hunts on purpose. White-tailed ptarmigan reads as a clean statewide zero, because it was.
So when you find a county shaded pale, or hatched out entirely, resist the reflex to read "no birds." Read "few birds taken by hunters who reported it." On a species like chukar or mountain quail, some of the best country in the state sits in counties where the harvest number is small simply because hardly anyone hunts there. The map tells you where the reported harvest is. Your own scouting, the habitat, and the access tell you the rest.
Reading it for your own season
Used with that caveat in mind, harvest data earns a real place in your e-scouting. Three ways we'd put it to work.
First, as a confirmation layer. If you've picked a region off habitat and access, the harvest map is a fast gut-check: are hunters actually taking your target bird in that county, or is your read purely theoretical? A strong number is reassurance. A blank one is a prompt to ask why — thin birds, or thin hunters?
Second, as a pressure read. The counties with the biggest harvest numbers are, by definition, the counties where the most hunters are having the most success — which also means the most company. For a hunter willing to trade a sure thing for solitude, the interesting counties are sometimes the ones just off the leaderboard: real birds, fewer trucks at the trailhead. The map makes those adjacent counties easy to spot.
Third, as a species-spread tool. Tap a single county and you'll often find three, four, five species reported together — the makings of a mixed-bag day. The combined view is built for exactly this: finding the overlap country where a morning of valley quail can turn into an afternoon of dove or a climb after mountain quail without changing counties.
None of this replaces boots and glass. Pair the harvest read with the range and habitat picture — our California Valley Quail and California Dove cornerstones go deep on where each bird actually lives — and with a real public-land access plan, the ground we covered in E-Scouting NorCal Upland Public Land. Harvest is one input. A good plan uses several.
Where this goes next
This first version is the harvest layer, and it's the foundation. The county geography is real, the numbers are sourced, and the map is built to grow. The next layers we're planning sit right on top of it: recent wildfire burn scars and the one-to-few-year regrowth that lights up quail habitat, and a hunt-planning read on weather, drought, and fall smoke. We'll roll those out as they're ready and note them here.
For now, the map is live and the birds are on it. Go find the county you thought you knew and see whether the numbers agree with you. If you want new tools and planning pieces in your inbox each Sunday — plus our 2026-27 California Upland Cheatsheet as a thank-you — the subscribe page is the place.
The numbers are CDFW's. The mental map is yours. This is where the two finally meet.
— Matt California Upland
Matt Gehrmann grew up hunting the Central Valley for pheasant, quail, and dove, and is based in the Bay Area. Read more → · Subscribe to the weekly digest →