
Reading Recent Burns for Birds: The New Fire Layer on California's Upland Map
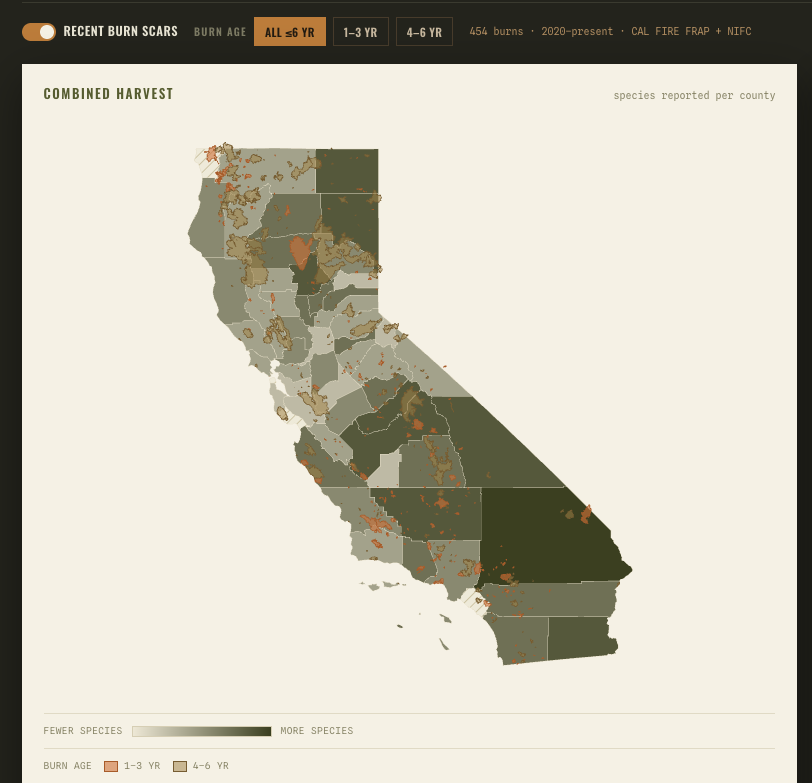
There's a piece of California upland knowledge that sounds wrong the first time you hear it: some of the best quail country in the state is ground that burned two years ago. Not the black, still-smoking kind — the kind that's had a spring or two to come back, where the brush that used to be an impenetrable wall is now a mosaic of green forbs, seeding annuals, and open feeding lanes with edge cover a covey can duck into. Hunters who've found that country tend to go looking for it on purpose ever after.
So we added it to the map. When we built "Where the Birds Are" on CDFW's harvest data, the plan was always to layer habitat on top of the harvest picture. The first of those layers is live now: recent wildfire burn scars, pulled straight from CAL FIRE, colored by how long ago they burned. This piece is the companion to that feature — why a burn matters to an upland bird, what the new layer shows, and how to read it without getting ahead of what the data can honestly tell you.
As always, a note on what this is. We're not writing this as a burn we hunted last November. It's a habitat-and-tool explainer, built from fire-recovery research, from the body of work in our own burn-scar piece, and from the CAL FIRE perimeter data now driving the map. When we've hunted a specific California burn and can write the field report, that piece will carry the scene. This one gives you the layer and the reasoning.
Why a burn is good for birds
Fire, on the right ground and at the right interval, resets the clock on habitat in a way that favors quail. A mature stand of chamise or manzanita chaparral is thick security cover, but it's a food desert at ground level — the canopy has closed, the forbs are shaded out, and the bare, litter-choked floor grows little a quail wants to eat. Burn it, and the system does what California's fire-adapted plant communities have done for millennia: the shrub canopy opens, sunlight hits the soil, and the seed bank responds. The first couple of growing seasons after a fire bring a flush of forbs and annual grasses — exactly the broad-leaved plants and small seeds that carry a quail through late summer and give a hen the insect-rich, protein-dense feed she needs to bring off a brood.
The timing is the whole story, and it's why we colored the layer by age rather than just drawing every burn the same. The rough arc, well-documented in post-fire succession and long understood by quail hunters:
The first year is mostly bare — ash, blackened snags, erosion. Birds aren't there yet, and the ground can be closed, unstable, or unsafe.
The one-to-three-year window is the sweet spot. The forb-and-seed flush peaks, the burn is laced with the feeding openings and low regrowth quail key on, and the surviving unburned edges and drainages give the covey somewhere to run. This is the country worth scouting.
By four to six years, the burn is maturing. Shrubs are coming back, the canopy is starting to close again, and the peak forb flush fades — still productive edge, but on its way back to being that food-poor mature stand. Past that, the window has largely closed until the next fire.
Two honest caveats that keep this from being a treasure map. Not every burn helps — severity and vegetation type matter. A low-to-moderate burn through chaparral or grassland is the classic quail-maker; a high-severity crown fire through conifer, or a burn on ground that then washed out, can set habitat back rather than forward. And a fresh burn is often closed or unsafe — post-fire closures, hazard trees, and erosion are real, and access can be shut for a season or more. The layer shows you where it burned and how long ago; it can't tell you the burn severity, whether the ground reopened, or whether the birds actually moved in. That's what boots, glass, and a current land-status check are for.
What the new layer shows
Open the map and flip on Recent burn scars. California's fire perimeters from roughly the last six years draw over the county map, colored by burn age: orange for one-to-three-year burns — the prime window — and amber for four-to-six-year burns that are maturing out. An age filter lets you show just the young burns or just the older ones, and the status line tells you how many are loaded and from when.
Tap any burn and the panel gives you its name, the year it burned, its size in acres, its current age, and a short read on what that age means for regrowth — the same one-to-three-year logic, applied to that specific fire. From there we link you into the deeper burn-scar piece for the full treatment.
The data is real and current. The perimeters come from CAL FIRE's Fire and Resource Assessment Program (FRAP), the state's official fire-perimeter record, plus the interagency (NIFC/WFIGS) feed for this season's active fires. The map pulls them live, so as CAL FIRE publishes new perimeters, the layer keeps up on its own — you're not looking at a snapshot we froze months ago.
Reading it with the harvest layer
The burn layer gets more useful the moment you stop looking at it alone. The map's whole point is that you can put habitat over the harvest picture. So the move is to pick your bird — California valley quail is the obvious one for burn regrowth — see which counties actually put quail in the bag, and then turn on burns to find the recent fires sitting inside that quail country. A two-year-old burn in a county that reports real quail harvest is a very different prospect than the same burn in a county where quail barely register.
That pairing also keeps you honest about what harvest data is and isn't. As we covered when the map launched, a low or blank harvest number can mean few hunters, not few birds — and a fresh burn on lightly-hunted public ground is exactly the kind of place that can hold birds nobody's reporting. The burn layer is a reason to look harder at that pale-shaded county, not to write it off.
If you want to go deeper on the habitat side of this, the burn story rhymes with two things we've written before: how spring green-up in the bunchgrass sets up a quail year, and how spring rainfall shapes chick survival. A burn is another lever on the same machine: it's about the food and cover on the ground when the birds need it. And when you've picked a burn worth a look, the e-scouting workflow is how you turn a colored polygon into a plan — check current land status, find the legal access, and read the terrain before you ever load the truck.
What's coming next
The burn layer answers where and how long ago. The next question — and how did it come back? — is the one we're building toward now. A burn perimeter is a boundary; it doesn't tell you whether this spring actually produced the green flush or whether a dry year left the ground thin. The next layer we're adding will read the actual vegetation response inside a selected burn — the year-by-year forb-and-grass productivity curve — so a burn goes from "it burned two years ago" to "here's how green it came back." We'll write it up here when it's live.
For now, the fire layer is on the map. Go turn it on, find the recent burns sitting in your bird's country, and start a list of places to check when the ground reopens. If you want the next layer — and the planning pieces that go with it — in your inbox as we ship them, plus our 2026-27 California Upland Cheatsheet as a thank-you, the subscribe page is the place.
Fire is part of this landscape whether we like it or not. The least we can do is learn to read it for birds.
Matt Gehrmann grew up hunting the Central Valley for pheasant, quail, and dove, and is based in the Bay Area. Read more → · Subscribe to the weekly digest →